Wellbore diagrams in RigReports
Wellbore Diagram Software
Build well schematics from the data your team already captures, not from scratch, every time.
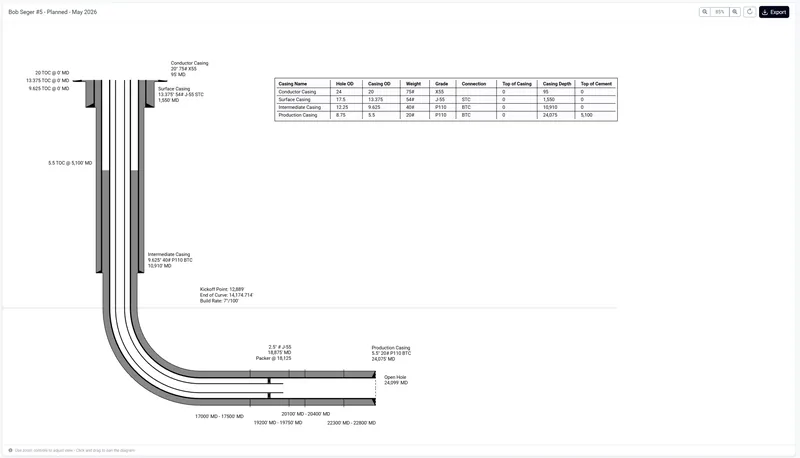
From well data to diagram
Most wellbore diagrams get drawn twice: once as data on daily reports, and again by hand in a drawing tool that knows nothing about that data.
Casing tallies, tubing details, perforation intervals and directional surveys are already entered on daily reports. The hand-drawn copy starts going stale the moment the well changes, and before long nobody is certain which version is current. Because your operational data is already structured in RigReports, a wellbore diagram is something you generate from it rather than redraw alongside it.
- 01Daily operationsCasing, tubing and perforations are recorded as the work happens.
- 02Structured well dataThat data is stored against the well, job by job.
- 03Well historyEvery job on the well is available as a source.
- 04Wellbore diagramThe schematic is generated from it, then refined.
Data sourcing
Build a diagram from data you have already entered
Import casing, tubing and perforations from existing jobs
When you create a diagram from a well in the Well Vault, RigReports scans that well for jobs containing casing, perforation and tubing data, and selects the most recent of each automatically.
You are not stuck with those picks. Each component type shows the job it came from, and you can open a table of every job on the well that carries that data, preview the components in each, and choose a different source. Total depth and the effective date prefill from the job you selected, with a note recording where they came from, and both remain editable.
Any of the three can be skipped and entered by hand instead, so a well with incomplete data can still be diagrammed.
Learn how to create a wellbore diagram →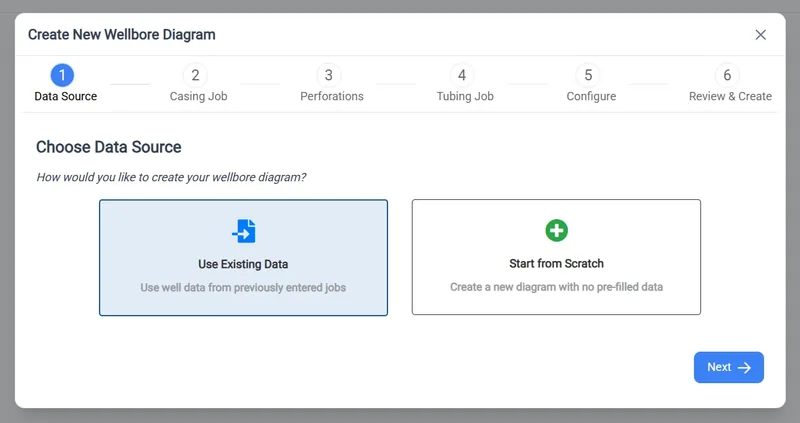
Or start from scratch
For a well with no history in RigReports, such as a recent acquisition or one still being brought into the system, choose Start from Scratch and enter casing, tubing and perforations directly in the editor. The diagram behaves identically from there.
Well geometry
Vertical and horizontal wells
Both are supported as distinct well types, and the geometry is calculated, not approximated.
Directional-survey-driven curve geometry
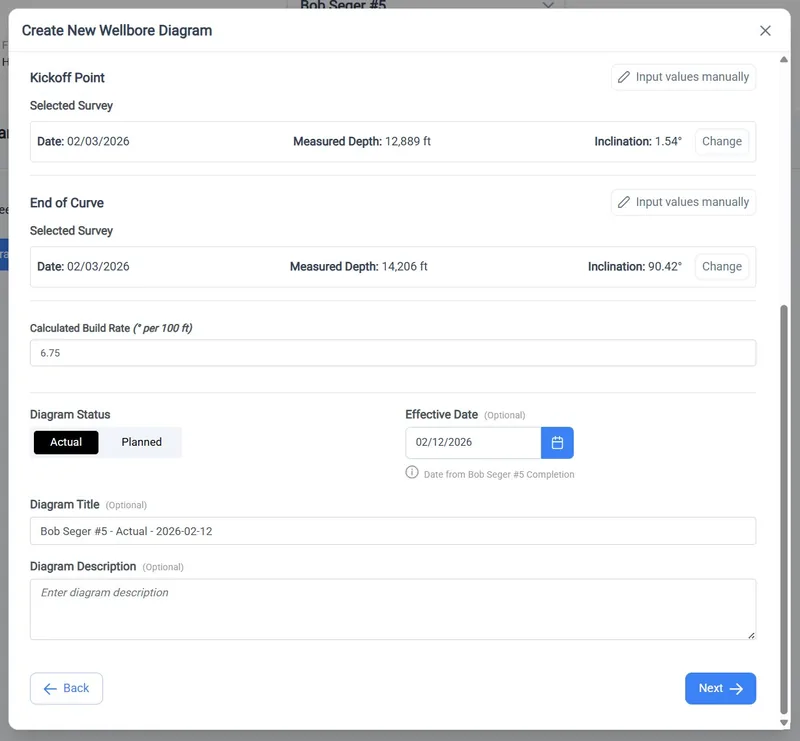
For a horizontal well, the kickoff point and end of curve can be selected straight from the well's directional surveys. RigReports lists the surveys, you pick the station that represents each, and build rate is calculated automatically from the two.
If the well has no surveys loaded, enter measured depth and inclination manually. Build rate is still calculated for you.
- KOP
- Kickoff point, picked from a survey station or entered as MD and inclination
- EOC
- End of curve, from surveys or manual entry
- BUR
- Build rate, calculated automatically from the two
Diagram status
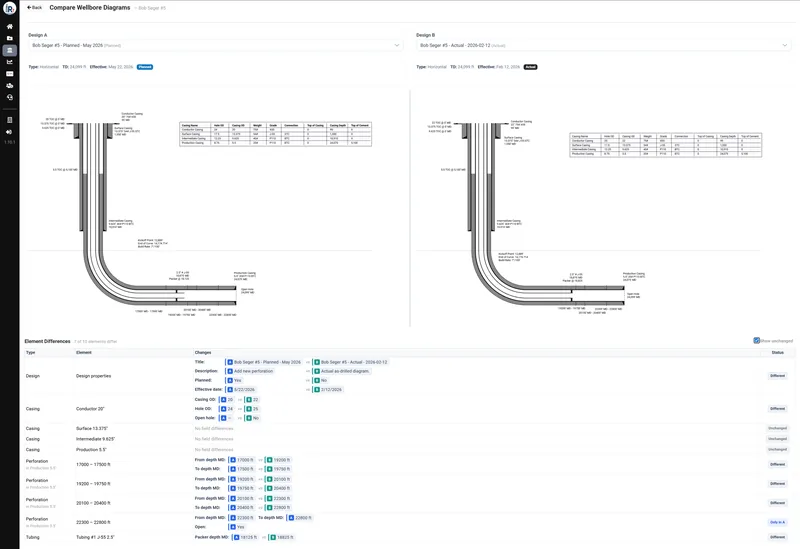
Planned vs. actual schematics
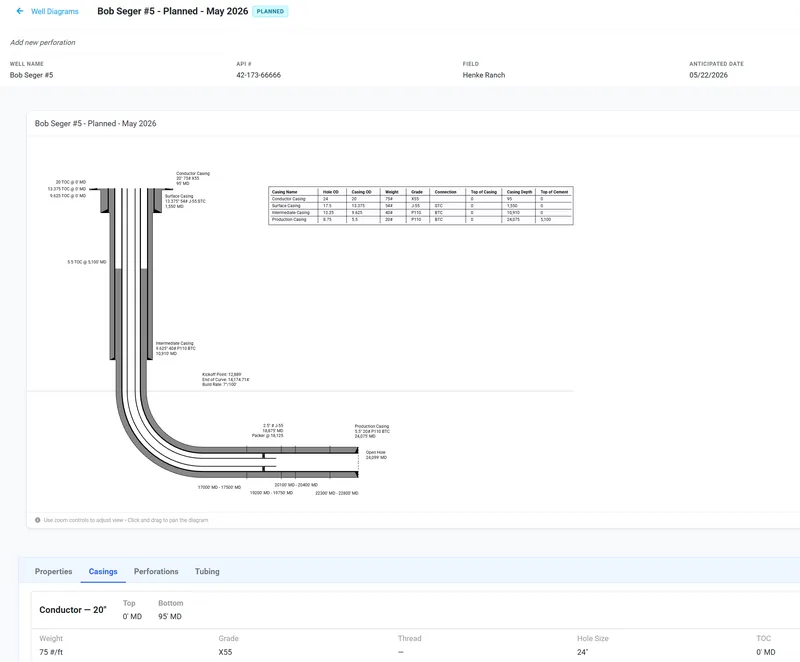
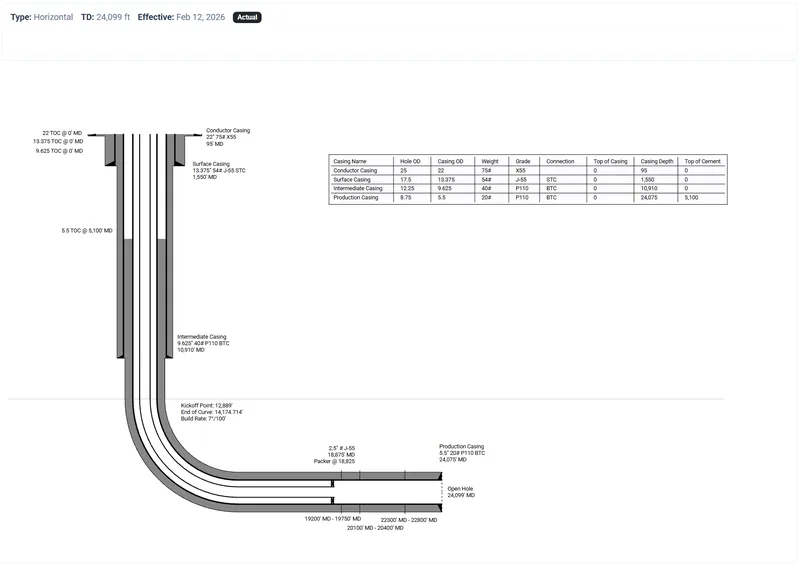
Every diagram carries a status.
The well as it is
As drilled or as completed, dated to the most recent change.
The well as it will be
A proposed configuration for upcoming drilling or completion work, dated to when the change is anticipated.
That makes diagrams useful for planning. A recompletion or a P&A can be drawn against the well as it stands today, reviewed, and then checked against the actual diagram once the work is done, without either version overwriting the other.
We'll build one with you on a well you know.
Editing
Edit every component
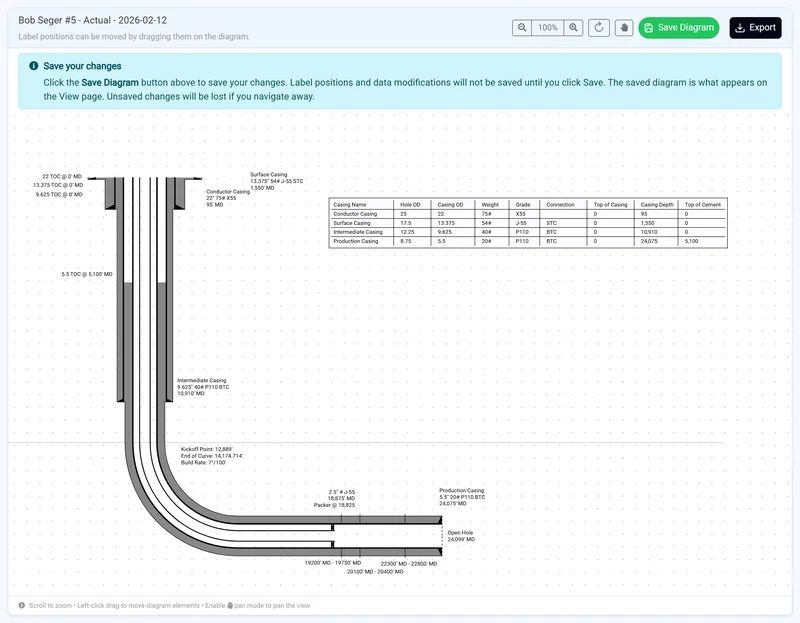
You can change anything you import. Diagram properties, casings, perforations and tubing can all be edited after creation, and the diagram regenerates from your changes.
Labels and tables are draggable, so a crowded shoe depth or a tight perforation cluster can be moved somewhere legible. Save the diagram to keep those positions; the viewer shows exactly the layout you saved.
Output
Export and share
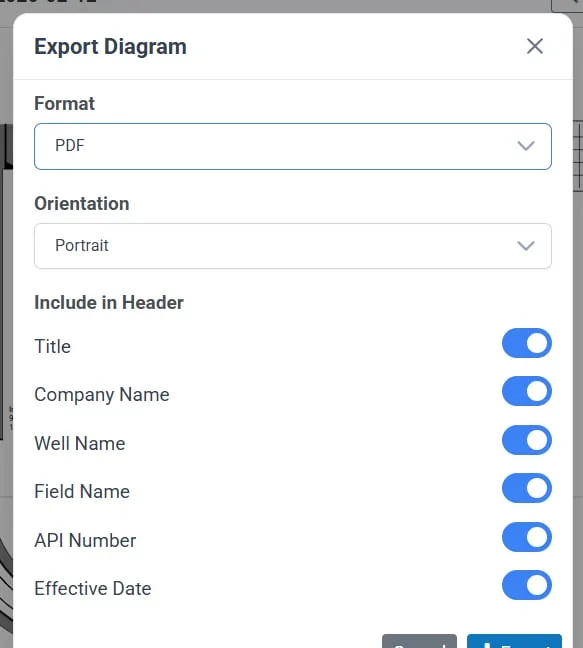
Export from the viewer in your choice of format. PDF export lets you set page orientation and choose which well data appears in the document header, so the schematic goes out as a document that identifies itself: suitable for a partner, a regulator, or a well file.
The viewer also shows the design specifications behind the diagram, so anyone reviewing it can check the casing, tubing and perforation values it was built from instead of trusting the picture.
Learn how to view and export a diagram →History
A diagram that stays current
Wells change. Diagrams are kept per well, with filtering, so earlier versions stay available rather than being overwritten. You keep a visual record of the wellbore as it was at each stage.
When a well changes in a small way, copy an existing diagram and adjust it rather than rebuilding it. Because the underlying casing, tubing and perforation data lives in the same system as your daily reporting, keeping the schematic current is a short task instead of a project.
Learn how to copy a wellbore diagram →Five steps
How it works
- 01Open the wellFind it in the Well Vault and add a new diagram.
- 02Choose your data sourceImport from existing jobs, or start from scratch.
- 03Confirm the geometryWell type and total depth, plus kickoff and end of curve for horizontals.
- 04Generate and refineReview the imported components, adjust, reposition labels and save.
- 05Export or shareStraight from the viewer, as a PDF with your choice of header data.
FAQ
Frequently asked questions
Common questions about wellbore diagrams in RigReports. Don't see yours? Ask us during a demo.
Schedule a demo
What is a wellbore diagram?
A wellbore diagram, or well schematic, is a scaled vertical drawing of a well's construction. It shows casing strings and their setting depths, tubing, packers and downhole equipment, and perforated intervals, giving anyone working the well a single picture of its current configuration.
What is the difference between a planned and an actual wellbore diagram?
An actual diagram records the well as drilled or completed. A planned diagram shows a proposed configuration for future work. Keeping both lets a team review intended changes against the current wellbore, then confirm the result once the work is finished.
Can I create a wellbore diagram from data already in RigReports?
Yes. RigReports detects jobs on the well that contain casing, perforation and tubing data and imports them into the diagram. It selects the most recent job for each automatically, and you can review the available jobs and choose a different source.
Does RigReports support horizontal wells?
Yes. Horizontal wells are a distinct well type. Kickoff point and end of curve can be selected from the well's directional surveys or entered manually, and build rate is calculated from those values.
Can I export a wellbore diagram to PDF?
Yes. Export from the diagram viewer and select your format. For PDF you can set the page orientation and choose which well data is included in the document header.
What happens to a diagram when the well changes?
Diagrams are kept per well and remain available as a historical record. For an incremental change, copy an existing diagram and edit the copy, so earlier versions stay intact.
Do I need directional surveys to diagram a horizontal well?
No. Surveys make it faster and more accurate, because kickoff and end of curve can be selected directly from survey stations. Without them, enter measured depth and inclination manually and RigReports calculates build rate from your values.
Next step
See it on your own wells
The fastest way to judge this is against a well you know. We will walk through building a diagram from real operational data and show you what comes out the other side.